September 11th 2020
Economic systems are systems that concerns itself with the production, transfer and consumption of useful or desirable, and therefore valuable, things and qualities. For a thing or a quality to be deemed useful or desirable, it should fulfill a need or desire of an entity. While there are four entities in an economic system: humans, governments, financial enterprises and non-financial enterprises, only one of them, viz., humans, is the original and real entity. All the other three, viz., governments, financial enterprises and non-financial enterprises, are notional entities envisioned and brought to life by the original entity, i.e., us humans, to facilitate the production, transfer and consumption of what we humans needed or desired.
The human species, being the only real element of the economic system, by design, will always last as long as if not longer than the three notional entities. Therefore, in the absence of another superior intelligent natural or artificial life form coopting the economic system for its own benefit and superseding humans, it can be argued that the bed of fundamental and foundational human needs and desires would always be the ground, the bastion, that holds and provides stability to the principal root of economic systems and supplies the primary life force for the economic tree that grows on those roots.
The economic tree could fulfill the needs and desires of any of the entities as it grows. However, a trunk that outgrows or allowed to outgrow what the principal root and its main holding ground can support will fall. Human needs and ability to pay to fulfill those needs will have to power all activities of all enterprises in the system directly or indirectly. Assets borne as fruits on the economic tree whose principal root is not on, and therefore does not derive its primary strength from, the fundamental needs and desires of humans, and made viable by means of authentic financial affordability will not reliably serve its true masters, i.e., humans, and may also be illusory or ephemeral. Conversely, if all activities, benevolent and profit making, are supported through the fruits of the economic system that can endure, i.e., rooted on genuine human needs and capability to pay to fulfill those needs, the enterprises conducting those activities will also endure driving the growth of the economic tree bringing with it gifts.
Consequently, a deeper understanding of the human needs and desires and what we humans perceive as valuable could be powerfully helpful, if not essential, in not only guiding us towards opportunities that build and spread wealth and happiness and that play a productive and useful role in the development of this world, but also guiding it towards a stable path of longevity. This is applicable regardless of the lever through which we want to influence and drive the direction of its motion - be it through art or design or science or engineering or entrepreneurship or finance or policy or law.
Household consumption as evidence
The question then is what can be used to understand human needs and desires and the value placed upon those needs and desires? One path to deeper understanding lies within consumption. A fair proxy for the human need or desire is consumption segments of households. The value placed or perceived by the humans on those needs or desires is reflected in the share of consumption devoted to each of those segments.
Fortunately, such segmented household consumption data is available from the world bank to gain perspective. To be clear, this data is of the developing world which only represents a share (approximately 60%) of the world’s population. However, given that the human needs and desires we seek to understand are fundamental and foundational by nature, the share of data available would be sufficient to provide the necessary understanding. Further more, the categorization used by world bank segments the data adequately well into fundamental and foundational needs and desires of humans: Food & Beverage, Housing, Transport, Clothing & Footwear, Energy, Information & Communication Technology, Health, Education, Personal Care, Financial Services, Water Utility & Others. While there may be other even more better ways to segment consumption, the categorization here is a reasonable starting point. Therefore, the first order strategic insights we seek about the elements and proportions of the primary ambient mixture to nurture and propel economies can certainly be derived from the relative patterns that surface from this data set.
Aggregate consumption driven ordering
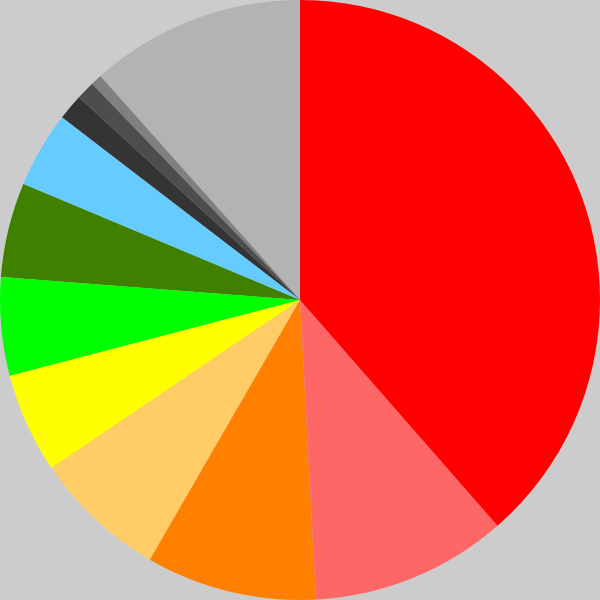
Looking at the basic data, at an aggregate level, food and beverage forms the largest share of consumption segment for a household, clearly representing its status as a tier one need. This is followed by seven other relatively dominant segments: housing, transport, clothing & footwear, energy, information & communication technology, health and education. Given their share of consumption, which indicates the relative value assigned to them on a per household basis, it may be possible to view the first three of these seven (at 11%, 9% & 7% share) as the second tier of needs and the last four of these (5%, 5%, 5% & 4%) as the third tier of needs. Together, the above 8 segments, resting on our foundational survival need and upliftment desire, represent more than four fifths of an average household’s consumption, with food & beverage alone typically representing half of that. Obviously therefore, under present conditions, it can be safely assumed that the base ingredients of the soil mixture for growing and sustaining economic systems are these 8 needs and desires; the rest of the gamut of human needs and desires may be considered to be of auxiliary nature.
While the essence of the above conclusion is surely truthful and meaningful, it must, however, be kept in mind that the conclusions drawn are based on consumption. To clarify, consumption is not a pure reflection of need and desire alone; it also factors in the ability to fulfill a need or desire, i.e., purchasing power, which in turn is a reflection of income level and corresponding credit access. The question therefore is how to isolate and understand the true ordering of these needs and desires?
Quasi-fundamental ordering

One argument can be that the segments ordered by consumption value when purchase power is low , i.e., savings, income and credit are scarce, will be a closer reflection of the true order of perceived value of the needs and desires. The world bank data set’s inclusion of % share of consumption across segments as a function of household income level is propitious here. The data set classifies income level into four categories: high, mid-high, mid-low and low. The low household income level data can be used as a proxy for the condition where purchase power is low.
By that measure, food & beverage would still remain as the undisputed tier one need. However, the demarkation between the second and third tier of needs and desires, is narrower here, because their consumption shares are smaller compared to the previous schema discussed, which was based on consumption across households of all income levels. The second tier here can be argued to be made of housing, energy and clothing & footwear, while the third tier includes the rest of the 8 of the previous schema, viz., health, transport, education and information & communication technology. Note that, in this method, energy need raises up to tier 2 status and pushes the transport need/desire to tier 3 status compared to the previous ordering. With the exception of that, overall, the two ordering drawn so far are mostly in alignment.
0% < ... > 100%
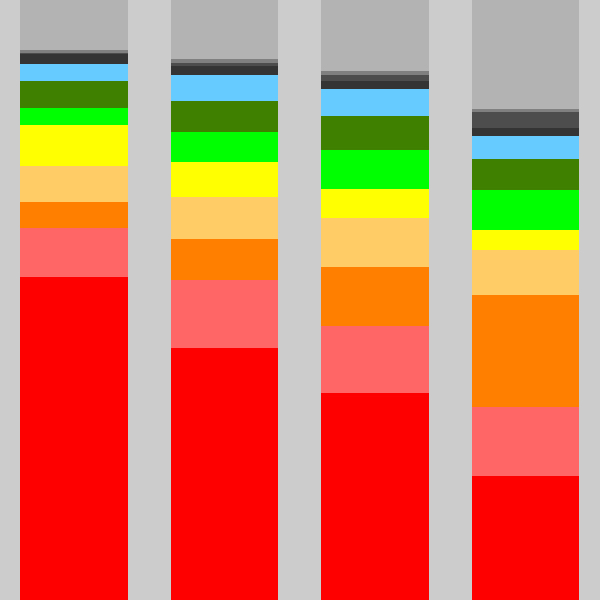
Income Level
However, closer examination of income level based consumption data brings the spotlight on the subtle difference between value and valuable or valuation. While interpreting the conclusions drawn in this schema, the insight offered appears to be into the order of perceived value i.e., fundamental importance of fulfilling a particular need or desire, on top of the order of perceived valuation i.e., purchasing power or share of that power we are willing to expend to fulfill a need or desire. For example, the above analysis suggests, for humans, housing is more important than transport, or energy need is more important to fulfill than transport need, and that more of the purchasing power will always be expended on fulfilling housing over transport need or energy over transport need. However, in fact, as can be seen from data for high income levels, the consumption share of transport is higher than that of housing and energy. Thus erupts the dissonance between value and valuable or valuation.
The war between what need or desire is perceived to be of value and what is perceived to be valuable, i.e., capable of claiming higher valuation, occurs because, once a particular need or desire is fulfilled to a minimum essential critical level or fully, the rest of the purchasing power may be directed in larger proportion or cumulative quantity towards another lower valued, i.e., less important, need or desire resulting in that lower valued need having higher valuation. One way to decouple and reconcile the disharmony between value and valuation is through the notion of tensility.
To begin the decoupling from the valuation end, it is necessary to stay on the first two models that rely on the magnitude of consumption share to draw inference and make certain clarifications. Magnitude of consumption share of a need or desire, without reservation, can be said to represent assigned valuation for that need or desire. It can also be reasoned that the assigned valuation is distilled from what is perceived as valuable. Therefore, the first two method’s inferences indubitably point to what is perceived as valuable. The difference between those two, among themselves, is that the first method infers what is perceived as valuable at an aggregate level across income levels, whereas the second method infers what is perceived as valuable when purchasing power is scarce. The two methods do not carry the burden of providing inference on what is the perceived value of a need or desire, although they can create that illusion.
Tensility driven orderingNeeds or desires have tensility, i.e., they have varying capacities to stretch, that comes into view only when the purchasing power comes into play. When purchasing power increases from low to high, one of the following three scenarios may happen: a need or desire is fulfilled and it does not expand further, or it expands but not faster than the increase in purchasing power, or it expands faster than increase in purchasing power. The second case will happen when a need has been de-prioritized as a result of it being fullfilled to a minimum essential critical level. The last scenario will happen when competing needs or desires have already been fulfilled or de-prioritized when this has not reached comparable status.
It can be contended that any need will eventually be fulfilled and stop expanding. When one stops to stretch with increase in purchase power, it is a sign that the need has been prioritized and fulfilled earlier than others which are continuing to stretch. It can then be reasoned that a nearly accurate indicator of the order of perceived value of the needs is the order in which they stop to stretch with increase in purchasing power. The stopping of stretching will manifest as a reduction in the consumption share with increase in income levels, given that income level is a proxy for the purchasing power. Expanding this, when a need stretches slower than the increase in purchasing power, it too is a sign that the need has been prioritized earlier than others which are continuing to stretch faster than purchasing power. This too manifests as a reduction in the consumption share with increase in income levels. However, its rate of reduction of consumption share will be slower than the rate of reduction of consumption share tied to a need that has been fully fulfilled. Thus, by using a reduction in the consumption share as a signal, it is possible to understand, in better depth, and in different light, compared to the previous schemas, the true order of needs based on perceived value.
To clarify and reinforce, the focus here is not on how much share of income is consumed by a segment or even how much reduction is evidenced in consumption share of a segment, but rather how fast they change as incomes change, and as the incomes increase, which segment’s consumption shares are starting to decrease first and faster. The value of consumption share of each of the segments, however, varies widely from one segment to another making it difficult to compare segments for rate of change in consumption with increasing income levels. For example, energy consumption share changes between 3% and 7% whereas food & beverage consumption share changes between 20% and 54% of total consumption. To compare them, they must be normalized to a standard reference frame that preserves the information on when and how fast they change. One of the ways by which this can be accomplished is dividing the consumption share of a segment at a particular income level by the consumption share of the same segment across income levels. Dividing the individual values by their average yields a factor hinged around the value one for each of the segments, since average will always be within the range of values that are being averaged, thus allowing for different segments to be compared.
The resultant normalized consumption data across income levels, when plotted, clearly reveals five distinct patterns within the consumption segments. As the income increases from low to high, in these curves, which we shall address as tensility curves:
- Normalized consumption decreases monotonically - Type 1
- Normalized consumption decreases first and then increases - Type 2
- Normalized consumption increases first and then decreases - Type 3
- Normalized consumption increases and then stabilizes but has not started decreasing - Type 4
- Normalized consumption increases monotonically - Type 5
0 < ... > 2
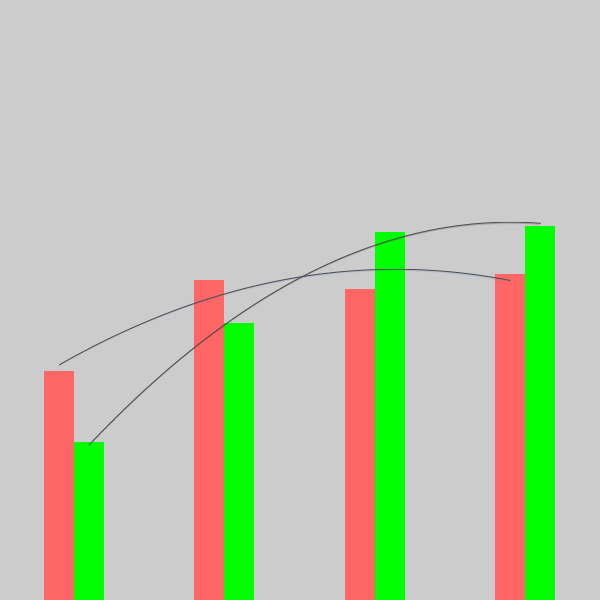
Income Level
The monotonic decrease curves indicating absence of tensility irrefutably points to needs that have been prioritized first. This is true of two segments, viz., food & beverage and energy. Their perceived value being almost identical is evidenced by their plots nearly fully overlapping each other. Interestingly, these two are fundamental to life and household.
A curve exhibiting a decrease followed by an increase is interesting because it suggests a need that has been prioritized first and fulfilled immediately to more than a minimum essential critical level, and then finding tensility at higher income levels. This is likely a manifestation of a need transitioning into full-fledged desire territory at high income levels and as a result managing to increase its consumption share at higher income levels. Personal care is the only segment that exhibits this unique behavior.
The curves that show an increase followed by a decrease demonstrates that those needs and desires were prioritized second and are fulfilled to more than the minimum essential critical level at higher income households using the larger purchasing power. Four segments, viz., water utility, education, health and clothing & footwear belong to this tier, with water utility clearly enjoying higher prioritization over education which in turn can be observed to enjoy a marginally higher preference over the other two.
Increase followed by stabilization of curves points to those needs’ prioritization being third in the order. Two segments housing and information and communication technology belong to this third tier. There is, however, a clear contrast between these two with housing enjoying a higher prioritization over information and communication technology given that the later’s consumption share increases after the former’s consumption share has stopped increasing.
Finally, monotonous increase in consumption share is observed for three categories, viz., others, transport and financial services, in that order, marking them indisputably as belonging to the fourth and last tier of need or desire with the greatest amount of tensility. These categories are obviously closely tied to increasing levels of wealth.
Needless to say, the ordering of needs and desires predicted by this model is fairly different from the previous two. Two factors have played a role in this. Importantly, by normalizing the consumption share data, the influence of magnitude of consumption share on the inference is isolated. As a result, the notion of value is decoupled from notion of valuation in this method while drawing inference on the perceived value of needs and desires. Further, unlike the previous models, that were based on consumption share of segments of a low income household only or of all households at an aggregate level, this method utilizes information across varying household income levels at a granular level to draw its inference. These two factors also certainly give strength to the inference drawn here as the most complete reflection of perceived value.
Marriage of valuation and value
With the method of drawing inference about value having been isolated from that about valuation, the issue of reconciliation of value with valuation comes to the fore. The mind is tuned to think value of a need or desire and valuation of that need or desire must be the same. But are they? A systems analogy helps in this cause. Any system is composed of entities and those entities have states in which they exist. Further, the root entities of the system, upon their birth, have a root starting state. Moreover, in the development course of the system, any entity born into or of the system follows a certain dynamic to change its state and reach its current state from its previous state, which, needless to say, begins with the root starting state. The dynamic course is a function of the factor(s) that can influence the entity in the system. Finally, the system itself will have a cumulative state at a particular point in the development course of the system which is merely a sum of the states of all the entities in the system.
In the system of human entities where the state of their needs and desires is of interest: The aggregate level consumption share data across households at a point in time reflects the cumulative state of the system at that point in its development course. Thus, the assigned, and therefore perceived, valuation of needs and desires at an aggregate level inform of the cumulative state of the system. The consumption share when income level is low can be argued to be the the root starting state of human entities in the system. This, of course, is the perceived fundamental valuation or perceived valuation of needs and desires when purchasing power is scarce. The income level of the human entities is the influencing factor in the system helping direct and decide which needs or desires can be fulfilled. In other words, purchasing power is the factor that influences and directs the need fulfillment course followed by the entity as per a certain dynamic. The tensility curves as a function of income level is the standard dynamic the human entities follow in their course of fulfilling their needs and desires as their purchasing power changes. This is reflected by the perceived value of the needs and desires.
In short, what is perceived as valuable overall is a result of what is perceived as valuable when income is scarce, in combination with evolution and current distribution of income levels, and the perceived value of the needs and desires as dictated by the tensility curves. In other words, perceived valuation and perceived value are not one and the same. Perceived overall valuation of a need is a derivative of its perceived fundamental valuation and its perceived value in combination with income level.
On realignment of value with valuation
The order of needs and desires based on perceived value and that based on perceived valuation go out of alignment because of differing tensility between segments. The question that begs to be asked therefore is - between two needs, how does a lower valued need manage to squeeze higher valuation?
While this is a serious question that demands equally serious thought, on surface, at least part of the answer may lie in the ability to catalyze tensility formation. This may be accomplished by transforming the need into a desire and stroking that desire. Fulfillment of desire almost always demands premium value from those with higher levels of purchasing power, which causes the share of consumption to rise. In strategic terms, enterprises catering to fulfill the lower valued need encourage and create a craving towards and an illusion of value of their offering that is larger than its true value among those with abundant purchasing power. If the higher value needs that are loosing ground, i.e., loosing consumption share, can do this too, then perhaps they can gain some valuation back. Interestingly, the tensility curve of personal care segment bears proof to this possibility. But certainly what appears to be the case now is that the lower value needs are gaining valuation and their tensility curves reveal an exponential character. The consumption share cumulatively of the last 4 perceived lower value needs, viz., information and communication technology, others, transport & financial services, increase from 15.8% at low income level to 46.2% at high income level, a nearly 2 fold increase between the two income levels. As a result, perceived overall valuation of these 4 segments (31% consumption share) cumulatively enjoy a nearly 1 fold increase over their perceived fundamental valuation (15.8% consumption share).
Distillates & Implication
In conclusion, human needs and desires can be viewed to have value, fundamental valuation, and overall valuation with respect to one another. Of them, value is a function of tensility of the need when varying purchasing power comes to play. The fundamental valuation is the share of allocation of purchasing power that would be allocated to fulfill a need, dictated purely by the merit of the need, immaterial of the quantum of purchasing power available at disposal. This can be contended to be reflected in the consumption share data when purchasing power is scarce. The overall valuation is the share of allocation of purchasing power at an aggregate level.
| Perceived value | Fundamental valuation | Overall valuation |
| Food & Beverage | Food & Beverage | Food & Beverage |
| Energy | Housing | Housing |
| Personal Care | Energy | Transport |
| Water Utility | Clothing & Footwear | Clothing & Footwear |
| Education | Health | Energy |
| Clothing & Footwear | Transport | Information & Communication Technology Info. & Comm. Tech. |
| Health | Education | Health |
| Housing | Information & Communication Technology Info. & Comm. Tech. | Education |
| Information & Communication Technology Info. & Comm. Tech. | Personal Care | Personal Care |
| Others | Water Utility | Financial Services |
| Transport | Financial Services | Water Utility |
| Financial Services | Others | Others |
Under the current state of affairs, the order of needs and desires based on perceived value, fundamental valuation and overall valuation are shown here. While it is hard to imagine a different state of affairs, it is important to be cautious of attaching rigidity to the inferences here. For example, tensility curves can be influenced and altered through business strategy, policy and cultural norms. Quasi-fundamental valuation may be influenced through significant changes in relative pricing level of the solutions that fulfill needs and desires. Food and beverage’s premier position in perceived value order could be the only certainty among all given its fundamental life giving nature. Given the current state of affairs, however, the conclusions drawn so far may be relied upon.
From an immediate economic standpoint, it may be beneficial to prioritize the building and strengthening of the economic tree based on overall valuation order. Prioritizing capital flow, and industry development across the supply chain tied to the needs based on the overall valuation order, could help strengthen the economic tree trunk. However, in parallel, to hedge against vulnerabilities and volatilities that could be tied to the overall valuation order and to bring about durability, it would be beneficial to build around the value order of the needs and desires too, which in turn would move the valuation order into alignment with the value order. This, importantly, could potentially bring stability to the system as well as fairness. Consider that, on one hand, today, food & beverage production, particularly agriculture stage of the value chain, tied to the highest value fundamental need, is an industry that is stretched thin. In some corners of the world such as in pockets of India, it is even marked by suicide of farmers. On the other hand, inspite of communication and information technology needs being lower in the value order, the industry's players such as google or facebook enjoy multi-billion dollar profits with extremely high net margins on their operations. Credit must be given to their ability to tap into tensility. To bring about reordering, if so desired, the solution lies not merely in policy and anti-trust movements. The sustainable solution may lie in executing novel business strategies and models to drive tensility in the high value needs and desires, thus drawing capital towards such endeavors. Shifting societal viewpoints and norms through literature, arts and information that project, broadcast and reimprint on the human mind the inherently elevated values of those needs and desires may also help. Interestingly, personal care segment's tensility curve displays signals that suggest the viability of the possibility of boosting tensility. Bottom line is that strength and stability building in the economic tree is tied to truly delighting and dazzling humans with sound solutions to their high value and highly valuable needs and desires that also evoke excitement.
From The Dictionaries
Need - a thing that is wanted or required
Desire - a strong feeling of wanting to have something or wishing for something to happen
Value - the regard that something is held to deserve; the importance, worth or usefulness of something
Valuable - worth a great deal of money
Valuation - an estimation of something’s worth
Tensility - capable of being drawn out or stretched